
There’s antimony, arsenic, aluminum, selenium, and hydrogen and oxygen and nitrogen and rhenium… you all have heard that song, right? It’s “The Elements”, by Tom Lehrer! Easily one of the most informative and catchy tunes you’ll ever listen to! If you haven’t, stop right now and look it up. No, I’m not even kidding. I don’t care if it is 3 a.m. and your final is tomorrow (but shame on you for last minute cramming!), stop and google it. It not only is a very enjoyable song, but it is a wonderful introduction into the topic of this blog post: the Periodic Table! This blog post is going to cover just about everything you’ve ever needed to know, wanted to know, and probably some things you’ve never thought about knowing!
There is no better place to begin than the beginning. And by beginning I mean the very beginning…as in, the birth of the Periodic Table. Now I won’t bore you with the historical details. What you need to know you probably do, but as a general recap: chemist Dmitri Mendeleev used his knowledge of similar elemental properties to develop the Periodic Table we are most familiar with today. His table contained many gaps (as there were many elements missing by today’s standards), however the trends established by the chart led to the correct prediction of the existence of undiscovered elements (which filled aforementioned gaps). An important fun fact is that Mendeleev did not have any of the Noble Gases in his table. After all, there was no evidence for them as they react with nothing, and the holes left in his table were not noted, and must have been regarded as the edge of the chart.
Now on to something a little more interesting: in my chemistry class we were able to create our own Periodic Tables! We had to use given elements, and sort them into any logical pattern we see fit. My group chose to create a rather long table. Our columns were, in order from left to right: gasses, liquids, solids, metalloids, and metals. Our rows were demonstrated descending atomic mass (truth be told, we did not have defined rows. Our chart was more of a “waterfall”). This quality does match the Periodic Table today, as going from left to right (and gradually top to bottom) yields an increase in atomic mass. While this sounds very useless in the field of science, this project yielded some very important results. It made my class have a new appreciation for the structure of the Periodic Table today. Sure ours was able to adapt to new elements and have organization. But it lacks the compactness and complexity of today’s table. You never realize how beneficial Mendeleev was until you try to build it for yourself.
A far away picture of our Periodic Table:

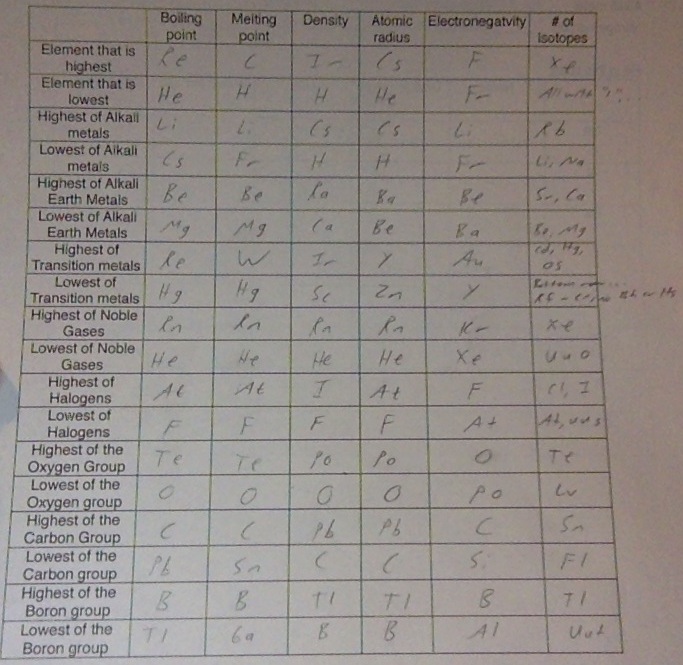
Ok, so now the Periodic Table has been born! Over the years, it has been adapted and altered to accommodate newly discovered elements. But what is the use of this updated chart if you aren’t familiar with the elements that it represents? It is very important to become comfortable with the Periodic Table. Doing so will save you countless quantities of time that would otherwise be spent searching for that one pesky element (trust me, I’ve been there). To help along the way, I have created a chart that points out some of the major landmarks on the Periodic Table. It is pretty self explanatory, and will help increase your familiarity with the elements as a whole. Check it out:
While the above chart is a wonderful tool, it does not truly divulge the secrets that the Periodic Table is hiding. Just as a warning, we are heading into that are of the blog post where there will be things you probably never knew existed. There are many trends, quite subtle or unmarked, that occur on the Periodic Table. Learning about these trends and features will make you a true chemist! Refer to the following picture as we describe these features.

First, the basics! The Periodic Table is divided into columns called groups, and rows called periods. As mentioned before, the elements are arranged by increasing atomic number. The farthest left group (labeled 1) are elements known as Alkali Metals. Group 2 are Alkaline Earth Metals. Groups 3-12 are known as the Transitional Metals. The green diagonal strip of elements are known as Metalloids. Groups 14-17 are known as nonmetals (with group 17 specifically being called Halogens). Group 18, on the far right, are known as the Noble Gases.
Another important feature is that the period number (numbers 1-7) designate the number of valence electrons of that element. So, Hydrogen and Helium both have one valence electron because they are in period 1. How many valence electrons would Sodium have? (Answer: 3. It is in period 3). This is an important concept because, as you’ve heard before, the elements are organized based on similar properties. The similar properties occur because of similar reactivity (which is caused by the same number of electrons). The same can be said for Groups 1, 2, 13-18. Their number represents their valence electrons (note: oxygen has 6 valence electrons, not 16. Neon has 8, not 18, and so forth). Isn’t it neat when everything makes sense?
If you have been following my blog, then you have already read about the energy orbitals that occur within atoms. The Periodic Table also has the elements sorted based on these energy orbitals. The s-block contains elements that only occupy the s-orbital. The d-block represents the elements that fill out the d-orbitals, and so on. If you are confused with the term orbitals or the letters “s,d,p,f”, then please refer to my original blog post on Modern Atomic Theory. Check out the picture below:

Now it is time to look at other general trends that occur across the Periodic Table. To help with this, please refer to this very interesting, interactive Periodic Table (located here). The link demonstrates the concepts I’m talking about below, and shows how they apply to each and every element. Be sure to take a look! Now, other trends occur as follows:
Atomic Radius: Decreases left-to-right across a period, but increases top-to-bottom down a group.
Ionization Energy (energy required to remove an electron): Increases left-to-right across a period. Also, generally decreases top-to-bottom down groups.
Electronegativity (ability to attract electrons): Increases left-to-right across periods, and decreases top-to-bottom down a group.
Other trends, as well as the ones listed above, are compacted into a single, useful chart. Enjoy!

So there you have it! You’ve come a long way with the Periodic Table! We started with the invention of it all, where we gained a new appreciation for just how difficult it is to arrange so many different elements. Then we became acquainted with some of the key characteristics of the elements on the Periodic Table. And, last but not least, we took a look at some of the secrets that hide themselves among the table itself. I hope that I’ve turned your “needed to know”s, “wanted to know”s, and “never knew”s into “now I understand”s!
…now seriously, go look up that elements video! Trust me, it’s definitely worth it!
